|
DSP Equity Savings Fund An open ended scheme investing in equity, arbitrage and debt |
|


|

- Invests in 1/3rd each Equity, Arbitrage And Debt providing equity taxation.
- The overall portfolio captures some upside potential from pure equities with significantly lower volatility due to debt, therefore has the potential to generate better returns per unit of risk with an equity taxation structure.
Vinit Sambre (Equity portion)
Total work experience of 19
years Managing the Scheme
since June 2020
Saurabh Bhatia (Debt Portion)
Total work experience of 16
years. Managing this Scheme
since March 2018.
Jay Kothari (Dedicated
Fund Manager for overseas
investments)
Total work experience of 14 years.
Managing this Scheme since
March 2018.
Mar 28, 2016
30% Nifty 500 TRI + 70% CRISIL Liquid
Fund Index
(The benchmark assumes quarterly rebalancing)
| Regular Plan | |
| Growth: | ₹ 12.363 |
| Direct Plan | |
| Growth: | ₹ 13.142 |
₹ 436 Cr
₹ 437 Cr
4.09
| Standard Deviation : | 11.25% |
| Beta : | 1.67 |
| R-Squared : | 90.42% |
| Sharpe Ratio : | -0.16 |
| Regular Plan : | 2.40% |
| Direct Plan : | 0.85% |
1.01 years
0.91 years
4.88%
Conservative Hybrid
4 Yr 3 Mn
| AUM as on 30 June2020 (₹ in Cr) | 436 |
• If the units redeemed or switched out are upto
10% of the units (the limit) purchased or switchedin
within 12 months from the date of allotment: Nil
• If units redeemed or switched out are in excess
of the limit within 12 months from the date of
allotment: 1%
• If units are redeemed or switched out on or after
12 months from the date of allotment: NIL.
@@Computed on the invested amount for debt portfolio
| Name of Instrument | % to Net Assets | |
| EQUITY & EQUITY RELATED | ||
| Listed / awaiting listing on the stock exchanges | ||
| Banks | 6.75 | |
| ✔ HDFC Bank Limited | 3.60 | |
| ✔ ICICI Bank Limited | 2.55 | |
| Kotak Mahindra Bank Limited | 0.60 | |
| Consumer Non Durables | 5.09 | |
| ✔ Dabur India Limited | 1.40 | |
| Hatsun Agro Product Limited | 1.08 | |
| Asian Paints Limited | 1.01 | |
| Britannia Industries Limited | 0.81 | |
| Hindustan Unilever Limited | 0.79 | |
| Finance | 4.25 | |
| ✔ Bajaj Finance Limited | 2.11 | |
| Max Financial Services Limited | 1.00 | |
| HDFC Life Insurance Company Limited | 0.64 | |
| ICICI Lombard General Insurance Company Limited | 0.50 | |
| Consumer Durables | 3.55 | |
| Voltas Limited | 1.23 | |
| Crompton Greaves Consumer Electricals Limited | 0.96 | |
| V-Guard Industries Limited | 0.78 | |
| Blue Star Limited | 0.58 | |
| Pharmaceuticals | 3.36 | |
| ✔ IPCA Laboratories Limited | 1.80 | |
| Cipla Limited | 1.00 | |
| Eris Lifesciences Limited | 0.56 | |
| Auto Ancillaries | 2.98 | |
| Minda Industries Limited | 0.97 | |
| Balkrishna Industries Limited | 0.82 | |
| Motherson Sumi Systems Limited | 0.67 | |
| Exide Industries Limited | 0.52 | |
| Petroleum Products | 2.42 | |
| ✔ Reliance Industries Limited | 1.84 | |
| Bharat Petroleum Corporation Limited | 0.49 | |
| Reliance Industries Limited - Partly Paid Shares | 0.09 | |
| Software | 2.05 | |
| ✔ Infosys Limited | 1.04 | |
| Tata Consultancy Services Limited | 1.01 | |
| Telecom - Services | 1.71 | |
| ✔ Bharti Airtel Limited | 1.71 | |
| Cement | 1.41 | |
| Shree Cement Limited | 0.76 | |
| Grasim Industries Limited | 0.65 | |
| Textile Products | 0.86 | |
| Welspun India Limited | 0.86 | |
| Gas | 0.80 | |
| Gujarat State Petronet Limited | 0.80 | |
| Industrial Products | 0.79 | |
| Cummins India Limited | 0.63 | |
| Wim Plast Ltd. | 0.16 | |
| Industrial Capital Goods | 0.74 | |
| Bharat Electronics Limited | 0.74 | |
| Media & Entertainment | 0.67 | |
| Music Broadcast Limited | 0.67 | |
| Construction Project | 0.67 | |
| Larsen & Toubro Limited | 0.67 | |
| Oil | 0.61 | |
| Oil & Natural Gas Corporation Limited | 0.61 | |
| Chemicals | 0.58 | |
| Atul Limited | 0.58 | |
| Services | 0.51 | |
| Quess Corp Limited | 0.51 | |
| Power | 0.51 | |
| CESC Limited | 0.51 | |
| Ferrous metals | 0.42 | |
| Tata Steel Limited | 0.41 | |
| Tata Steel Limited - Partly Paid Shares | 0.01 | |
| Auto | 0.40 | |
| Ashok Leyland Limited | 0.40 | |
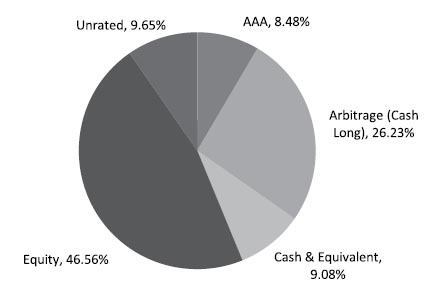
| Total | 41.13 | |
| Arbitrage (Cash Long) | ||
| Stock Futures | -26.14 | |
| Total | 26.23 | |
| Units issued by REITs & InvITs | ||
| Listed / awaiting listing on the stock exchanges | ||
| Finance | 5.43 | |
| ✔ India Grid Trust | 5.43 | |
| Total | 5.43 | |
| DEBT INSTRUMENTS | ||
| BOND & NCD's | ||
| Listed / awaiting listing on the stock exchanges | ||
| ✔ Reliance Industries Limited | CARE AAA | 5.99 |
| ✔ Power Finance Corporation Limited | CRISIL AAA | 2.49 |
| Total | 8.48 | |
| MONEY MARKET INSTRUMENTS | ||
| TREPS / Reverse Repo Investments / Corporate Debt Repo | 7.89 | |
| Total | 7.89 | |
| Fixed Deposit | ||
| ICICI Bank Limited 23 Nov 2020 (Duration - 367 Days) | Unrated | 1.19 |
| ICICI Bank Limited 23 Feb 2021 (Duration - 397 Days) | Unrated | 0.47 |
| Bank of Baroda 02 Feb 2021 (Duration - 377 Days) | Unrated | 0.47 |
| Bank of Baroda 04 Feb 2021 (Duration - 379 Days) | Unrated | 0.47 |
| Bank of Baroda 29 Jan 2021 (Duration - 373 Days) | Unrated | 0.47 |
| Bank of Baroda 01 Feb 2021 (Duration - 376 Days) | Unrated | 0.47 |
| Bank of Baroda 03 Feb 2021 (Duration - 378 Days) | Unrated | 0.47 |
| ICICI Bank Limited 24 Feb 2021 (Duration - 397 Days) | Unrated | 0.47 |
| Bank of Baroda 09 Feb 2021 (Duration - 383 Days) | Unrated | 0.47 |
| Bank of Baroda 11 Feb 2021 (Duration - 385 Days) | Unrated | 0.47 |
| Bank of Baroda 10 Feb 2021 (Duration - 384 Days) | Unrated | 0.47 |
| Bank of Baroda 18 Feb 2021 (Duration - 391 Days) | Unrated | 0.47 |
| Bank of Baroda 17 Feb 2021 (Duration - 390 Days) | Unrated | 0.47 |
| Bank of Baroda 16 Feb 2021 (Duration - 389 Days) | Unrated | 0.47 |
| Bank of Baroda 18 Mar 2021 (Duration - 405 Days) | Unrated | 0.47 |
| Bank of Baroda 23 Mar 2021 (Duration - 410 Days) | Unrated | 0.47 |
| Bank of Baroda 19 Mar 2021 (Duration - 406 Days) | Unrated | 0.47 |
| Bank of Baroda 22 Mar 2021 (Duration - 409 Days) | Unrated | 0.47 |
| Bank of Baroda 17 Mar 2021 (Duration - 404 Days) | Unrated | 0.47 |
| Total | 9.65 | |
| Cash & Cash Equivalent | ||
| Cash Margin | 1.42 | |
| Net Receivables/Payables | -0.23 | |
| Total | 1.19 | |
| GRAND TOTAL | 100.00 |
✔ Top Ten Holdings
Notes : 1. All corporate ratings are assigned by rating agencies like CRISIL, CARE, ICRA, IND.
@@Computed on the invested amount for debt portfolio
| Growth of Rs. 1 L invested at inception: | 1.24 L |
| SIP Returns(In %) | ||||
| 10 yr | 5 yr | 3 yr | SI* | |
| *SI - Since inception | NA | NA | 0.17 | 2.05 |
| Outperformed Benchmark TRI (calendar year) |
70% CRISIL Liquid Fund Index + 30% Nifty 500 TRI 33%
|
| 10 yr | 5 yr | 3 yr | 1 yr | |
| Minimum | -- | -- | -1.6 | -13.5 |
| Maximum | -- | -- | 8.1 | 17.1 |
| Average | -- | -- | 4.9 | 5.1 |
| % times negative returns | -- | -- | 6.2 | 25.9 |
| % of times returns are in excess of 7% | -- | -- | 22.5 | 45.6 |
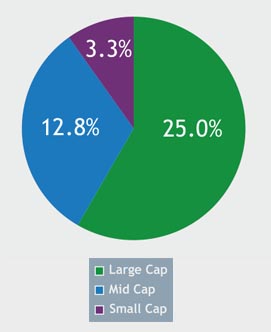
Mid Cap: 101st -250th company in terms of full market capitalization
Small Cap: 251st company onwards in terms of full market capitalization.
| Positions Exited |
| Petroleum Products |
| Hindustan Petroleum Corporation Limited |
| Castrol India Limited |
| Power |
| NTPC Limited |
| Media & Entertainment |
| Sun TV Network Limited |
| Gas |
| GAIL (India) Limited |
| Pharmaceuticals |
| Sun Pharmaceutical Industries Limited |
| Banks |
| AU Small Finance Bank Limited |
| Finance |
| Satin Creditcare Network Limited |
| Software |
| CESC Ventures Limited |
| New Position Bought |
| Software |
| Infosys Limited |
| Tata Consultancy Services Limited |
| Pharmaceuticals |
| Cipla Limited |
| Banks |
| The Federal Bank Limited |
| Positions Increased |
| Consumer Non Durables |
| Dabur India Limited |
| Positions Decreased |
| Banks |
| ICICI Bank Limited |
| Petroleum Products |
| Reliance Industries Limited |
| Finance |
| Bajaj Finance Limited |
Rebalances below 0.05 % are not considered.
An Open ended equity Scheme,
seeking to generate income through
investments in fixed income
ecurities and using arbitrage and
other derivative Strategies. The
Scheme also intends to generate
long-term capital appreciation by
investing a portion of the scheme's
assets in equity and equity related
instruments.
There is no assurance that the
investment objective of the
Scheme will be realized.
This Scheme is suitable for investors who are seeking*
• Long term capital growth and income
• Investment in equity and equity related securities including the use of equity derivatives strategies and
arbitrage opportunities with balance exposure in debt and money market instruments
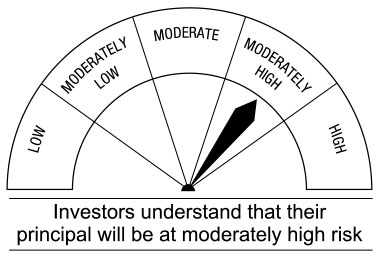
* Investors should consult their financial advisors if in doubt whether the product is suitable for them.