An open ended equity scheme following economic reforms and/or Infrastructure development theme
|
DSP India T.I.G.E.R. Fund (The Infrastructure Growth and Economic Reforms) An open ended equity scheme following economic reforms and/or Infrastructure development theme |
|


|
Rohit Singhania
Total work experience of 18 years.
Managing this Scheme since June
2010
Jay Kothari (Dedicated Fund
Manager for overseas investments)
Total work experience of 14 years.
Managing this Scheme since
March 2018.
June 11, 2004
S&P BSE 100 (TRI)
| Regular Plan | |
| Growth: | ₹ 92.283 |
| Direct Plan | |
| Growth: | ₹ 95.744 |
₹ 1,090 Cr
₹ 1,067 Cr
0.71
| Standard Deviation : | 18.72% |
| Beta : | 1.22 |
| R-Squared : | 71.95% |
| Sharpe Ratio : | 0.04 |
| Regular Plan : | 2.36% |
| Direct Plan : | 1.80% |
Sectoral/Thematic
15 Yr 4 Mn
| AUM as on 31 October 2019 (₹ in Cr) | 1,090 |
Holding period <12 months: 1%
Holding period >=12 months: Nil
| Name of Instrument | % to Net Assets |
| EQUITY & EQUITY RELATED | |
| Listed / awaiting listing on the stock exchanges | |
| Banks | 22.76% |
| ✔ ICICI Bank Limited | 8.27% |
| ✔ HDFC Bank Limited | 6.52% |
| ✔ Axis Bank Limited | 4.76% |
| ✔ State Bank of India | 2.38% |
| IndusInd Bank Limited | 0.82% |
| Construction Project | 10.83% |
| ✔ Larsen & Toubro Limited | 5.72% |
| Ashoka Buildcon Limited | 1.26% |
| H.G. Infra Engineering Limited | 1.08% |
| Techno Electric & Engineering Company Limited | 1.06% |
| Power Mech Projects Limited | 0.94% |
| Sadbhav Engineering Limited | 0.43% |
| Dilip Buildcon Limited | 0.34% |
| Industrial Capital Goods | 9.33% |
| ✔ Siemens Limited | 3.47% |
| Thermax Limited | 2.24% |
| BEML Limited | 2.24% |
| Bharat Electronics Limited | 0.77% |
| Bharat Heavy Electricals Limited | 0.61% |
| Power | 7.48% |
| ✔ NTPC Limited | 2.57% |
| Tata Power Company Limited | 2.24% |
| Kalpataru Power Transmission Limited | 1.51% |
| CESC Limited | 1.15% |
| Petroleum Products | 7.09% |
| ✔ Bharat Petroleum Corporation Limited | 3.43% |
| Hindustan Petroleum Corporation Limited | 2.25% |
| Reliance Industries Limited | 1.41% |
| Transportation | 6.94% |
| ✔ Gujarat Pipavav Port Limited | 2.34% |
| Adani Ports and Special Economic Zone Limited | 1.43% |
| Container Corporation of India Limited | 1.29% |
| Future Supply Chain Solutions Limited | 1.01% |
| Allcargo Logistics Limited | 0.49% |
| Gateway Distriparks Limited | 0.38% |
| Cement | 6.81% |
| UltraTech Cement Limited | 1.72% |
| ACC Limited | 1.46% |
| Ambuja Cements Limited | 1.27% |
| Shree Cement Limited | 0.99% |
| JK Lakshmi Cement Limited | 0.84% |
| Sanghi Industries Limited | 0.53% |
| Construction | 4.78% |
| KNR Constructions Limited | 2.23% |
| Ahluwalia Contracts (India) Limited | 1.45% |
| PNC Infratech Limited | 1.11% |
| Industrial Products | 4.31% |
| SKF India Limited | 1.35% |
| Carborundum Universal Limited | 1.09% |
| Finolex Cables Limited | 1.03% |
| Cummins India Limited | 0.85% |
| Finance | 3.97% |
| HDFC Life Insurance Company Limited | 1.29% |
| Mahindra & Mahindra Financial Services Limited | 0.97% |
| Aavas Financiers Limited | 0.95% |
| Satin Creditcare Network Limited | 0.76% |
| Telecom - Services | 2.50% |
| ✔ Bharti Airtel Limited | 2.50% |
| Non - Ferrous metals | 2.29% |
| Hindustan Zinc Limited | 1.05% |
| Vedanta Limited | 0.74% |
| Hindalco Industries Limited | 0.50% |
| Consumer Durables | 2.07% |
| Blue Star Limited | 1.50% |
| Crompton Greaves Consumer Electricals Limited | 0.57% |
| Oil | 1.60% |
| Oil & Natural Gas Corporation Limited | 1.60% |
| Chemicals | 1.26% |
| Solar Industries India Limited | 1.26% |
| Consumer Non Durables | 1.15% |
| Asian Paints Limited | 1.15% |
| Textile Products | 1.08% |
| Welspun India Limited | 1.08% |
| Gas | 0.76% |
| Gujarat State Petronet Limited | 0.76% |
| minerals/mining | 0.70% |
| Coal India Limited | 0.70% |
| Ferrous metals | 0.58% |
| Srikalahasthi Pipes Limited | 0.58% |
| Total | 98.29% |
| MONEY MARKET INSTRUMENTS | |
| TREPS / Reverse Repo Investments / Corporate Debt Repo | 3.43% |
| Total | 3.43% |
| Cash & Cash Equivalent | |
| Cash Margin | 0.04% |
| Net Receivables/Payables | -1.76% |
| Total | -1.72% |
| GRAND TOTAL | 100.00% |
✔ Top 10 Holdings
| Growth of Rs. 1 L invested at inception: | 9.23 L |
| SIP Returns(In %) | ||||
| 3 yr | 5 yr | 10 yr | SI* | |
| *SI - Since inception | 2.98 | 6.14 | 9.69 | 10.95 |
| Outperformed Benchmark TRI (calendar year) | S&P BSE 100 TRI 38% |
| 10 yr | 5 yr | 3 yr | 1 yr | |
| Minimum | 5.3 | -5.7 | -13.4 | -60.8 |
| Maximum | 19.8 | 31.6 | 69.0 | 118.8 |
| Average | 11.7 | 12.1 | 13.9 | 19.9 |
| % times negative returns | 0.0 | 8.5 | 15.3 | 33.0 |
| % of times returns are in excess of 7% | 93.9 | 74.0 | 67.3 | 58.0 |
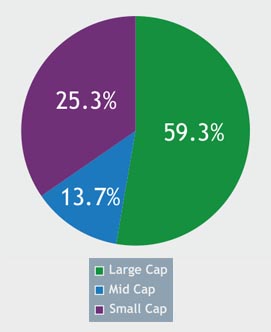
Mid Cap: 101st -250th company in terms of full market capitalization
Small Cap: 251st company onwards in terms of full market capitalization.
| Positions Exited |
| Stock |
| Petroleum Products |
| Indian Oil Corporation Limited |
| New Position Bought |
| Stock |
| Banks |
| State Bank of India |
| Transportation |
| Adani Ports and Special Economic Zone Limited |
| Non - Ferrous Metals |
| Vedanta Limited |
| Consumer Durables |
| Crompton Greaves Consumer Electricals Limited |
| Construction Project |
| Dilip Buildcon Limited |
| Positions Increased |
| Stock |
| Transportation |
| Gujarat Pipavav Port Limited |
| Petroleum Products |
| Hindustan Petroleum Corporation Limited |
| Bharat Petroleum Corporation Limited |
| Finance |
| Mahindra & Mahindra Financial Services Limited |
| HDFC Life Insurance Company Limited |
| Telecom - Services |
| Bharti Airtel Limited |
| Oil |
| Oil & Natural Gas Corporation Limited |
| Industrial Products |
| Carborundum Universal Limited |
| Industrial Capital Goods |
| BEML Limited |
| Positions Decreased |
| Stock |
| Transportation |
| Container Corporation of India Limited |
| Consumer Durables |
| Blue Star Limited |
| Construction Project |
| Larsen & Toubro Limited |
| Consumer Non Durables |
| Asian Paints Limited |
| Cement |
| UltraTech Cement Limited |
| Industrial Capital Goods |
| Siemens Limited |
| Petroleum Products |
| Reliance Industries Limited |
| Banks |
| HDFC Bank Limited |
| IndusInd Bank Limited |
| ICICI Bank Limited |
| Axis Bank Limited |
Rebalances below 0.05 % are not considered.
The primary investment objective of the
Scheme is to seek to generate capital
appreciation, from a portfolio that is
substantially constituted of equity securities
and equity related securities of corporates,
which could benefit from structural changes
brought about by continuing liberalization in
economic policies by the Government and/
or from continuing investments in
infrastructure, both by the public and
private sector.
There is no assurance that the investment
objective of the Scheme will be realized.
This Scheme is suitable for investors who are seeking*
• Long-term capital growth
• Investment in equity and equity-related securities of corporates, which could benefit from structural changes
brought about by continuing liberalization in economic policies by the Government and/or from continuing
Investments in infrastructure, both by the public and private sector
* Investors should consult their financial advisors if in doubt whether the product is suitable for them.